
According to AirDNA’s 2026 Outlook Report, released in December 2025, 2026 is shaping up to be the strongest year to invest in short-term rentals since 2021. ADR is forecast to rise 1.5%, RevPAR 0.6%, and U.S. listings will climb to roughly 1.77 million.
That’s good news. But here’s the part most beginner property owners miss: those are national averages. The same market that earns one owner $90,000 a year can earn another $32,000 across the street – same bedroom count, same square footage, different research.
The difference is a proper vacation rental market analysis. This guide walks you through exactly how to do one, even if you’ve never analyzed a rental market before.
Table of Contents
What Is a Vacation Rental Market Analysis?
A vacation rental market analysis is the structured process of figuring out whether a specific short-term rental property – or a specific market – will produce the income, occupancy, and risk profile you actually want.
Done right, it answers four questions in order:
- Macro: Is the broader U.S. short-term rental market healthy?
- Submarket: Is this city or neighborhood strong, weak, or oversupplied?
- Property: Will this specific address cash flow at the price I’d pay?
- Regulatory: Am I allowed to operate a short-term rental here, today and three years from now?
Skip any one of these layers and your numbers will lie to you. The good news is that with the right framework and tools, you can run a credible analysis in a single weekend.
Key Terms to Know Before You Start
Every Airbnb market research guide throws around jargon. Here’s the plain-English version:
- ADR (Average Daily Rate): What guests pay per night on average. Calculated as total booked revenue ÷ booked nights.
- Occupancy Rate: The percentage of available nights that get booked. A 60% occupancy means the property is booked 60% of the nights it’s listed.
- RevPAR (Revenue Per Available Rental): ADR × Occupancy. This is the single most important number in vacation rental analytics because it combines price and demand. A $300 ADR at 40% occupancy ($120 RevPAR) underperforms a $200 ADR at 70% occupancy ($140 RevPAR).
- Gross Annual Revenue: Total income from bookings before expenses.
- Net Operating Income (NOI): Revenue minus operating expenses, but before mortgage payments.
- Cap Rate: NOI ÷ Purchase Price. A measure of return that ignores financing. In most U.S. vacation rental markets, a 5-10% cap rate is healthy.
- Cash-on-Cash Return: Annual pre-tax cash flow ÷ total cash invested. This is what your money actually earns each year.
- Seasonality Index: Peak-month revenue ÷ average-month revenue. A value above 2.5 signals an extreme seasonal market – manageable, but you’ll need a cash reserve.
Keep these definitions handy. The rest of this guide uses them constantly.
How to Research the Airbnb Market: A 7-Step Process
This is the same workflow professional vacation rental managers use. You can complete most of it in a weekend.
Step 1: Define Your Buy Box
Before you look at a single listing, write down what you’re actually solving for. Budget, bedroom count, market type (urban, leisure, workforce, mid-term), management style (full-service or self-managed), and target cash-on-cash return.
A clear example: “I want a 2-3 bedroom condo under $550,000 in a year-round leisure market within driving distance of a major city, professionally managed, targeting 8% cash-on-cash and a 25% personal-use carve-out.”
That sentence eliminates 95% of the U.S. market before you start. Good.
Step 2: Choose a Market and Check the Macro Numbers
Now pick 3-5 candidate markets that fit your buy box. For each, you want three macro data points:
- ADR and occupancy trend over the last 24 months
- RevPAR growth year-over-year
- Supply growth (new listings) versus demand growth
The free version of AirDNA’s MarketMinder gives you most of this. Cross-reference against Skift’s vacation rental coverage for context on emerging trends.
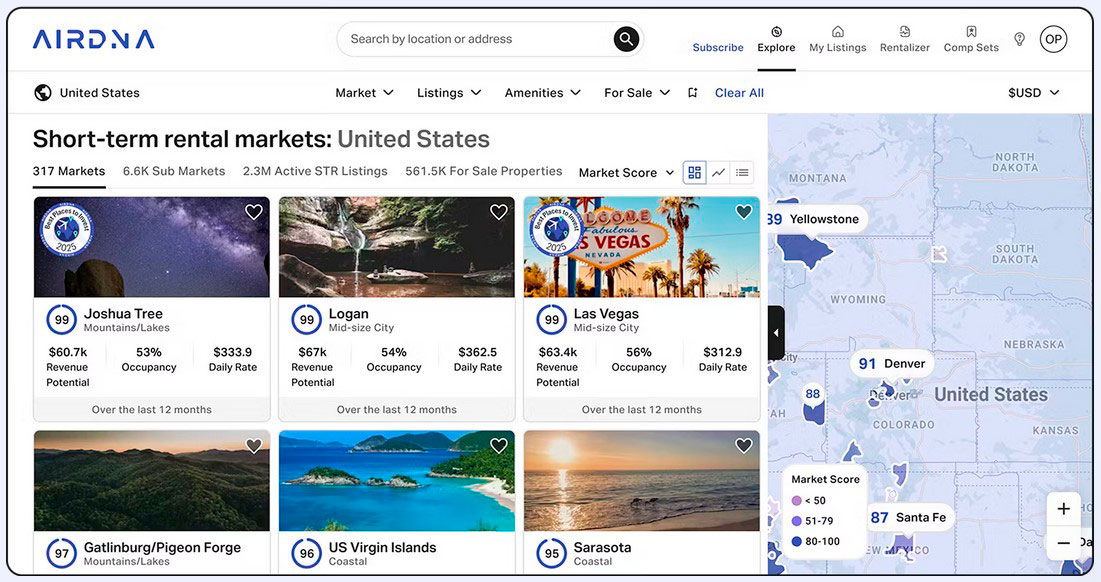
For perspective: AirDNA’s January 2026 U.S. market review showed national ADR at $246.62, RevPAR at $119.27, and occupancy at 48.4%. Any market you consider should at least match these averages – and you want supply growth that is being absorbed by demand, not creating oversupply.
Step 3: Zoom Into the Submarket
City-wide averages are almost useless. Performance can vary dramatically between two neighborhoods in the same metro.
Austin is the classic example. The city has a Market Score of 48 with 52% average occupancy – mediocre on paper. But submarket data shows Upper Boggy Creek (Market Score 93, 58% occupancy) and Hutto (Score 85) significantly outperforming the city average. Same approach applies to Miami, Denver, Phoenix, and every other major U.S. metro.
Use heat-map tools (AirDNA, AirROI, Rabbu) to identify the top-performing pockets. Look for proximity to tourist anchors, business districts, walkability, and transit. Then evaluate whether the property archetypes that win there match your buy box.
Step 4: Read the Short-Term Rental Regulations
This is where most beginner investors lose money. Short-term rental regulations have tightened sharply across the U.S. in 2025-2026, and the rule you buy under is rarely the rule you operate under five years later.
A few examples of what changed recently:
- New York City has reduced active Airbnb/Vrbo listings by roughly 70% since Local Law 18 took effect.
- Maui County passed Bill 9 in December 2025, phasing out roughly 7,000 apartment-zoned vacation rentals between 2029 and 2031.
- Honolulu’s Bill 62 reinstated a 90-day minimum stay in residential zones, with fines up to $10,000 per day.
- California’s SB 346 (effective January 1, 2026) requires platforms to share host data with cities.
- Austin will require platforms to display STR license numbers and remove unlicensed listings starting July 1, 2026.
- Breckenridge, Colorado caps non-exempt licenses at 2,200 and charges per-bedroom regulatory fees.
Always read the actual municipal ordinance – not a blog summary. Then check the HOA or condo documents separately. Many condo associations now ban short-term rentals outright, regardless of what the city allows.
Step 5: Build a Comp Set and Analyze Seasonality
Pick 10-25 active listings in your target submarket that match your buy box on bedroom count, amenities, walking distance, and quality tier. This is your comp set. Record:
- ADR (averaged over the last 12 months)
- Occupancy
- Review count and review velocity (reviews per month)
- Amenities (hot tub, pet-friendly, parking, EV charger)
- Booking lead time and median length of stay
Then map seasonality. Most U.S. vacation rental markets have a peak-to-trough revenue ratio of 2x to 5x. Real-world examples from AirROI and Airbtics data:
- Panama City Beach, FL: Peak month July; ADR peaks in June around $342; lowest demand in January.
- Breckenridge, CO: Peak month February; ADR peaks at roughly $740 December through February; lowest demand in May.
- Phoenix/Scottsdale, AZ: Peak month March; July-September revenue can be 4x lower than peak.
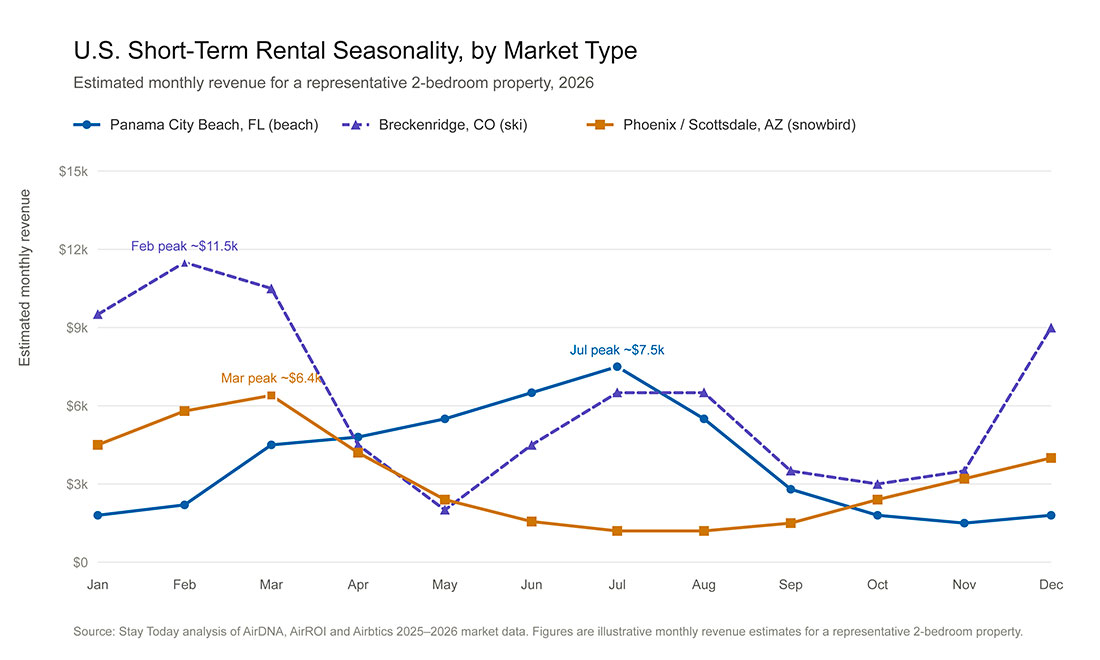
If you need 65% annual occupancy to break even and your comp set averages 54%, the deal is fragile no matter how good the peak season looks.
Step 6: Run Property-Level Revenue and Expense Projections
Now apply the comp-set data to a specific address. Use at least two Airbnb market research tools and triangulate:
- AirDNA Rentalizer – industry standard, address-level estimate
- Rabbu’s free revenue estimator – quick second opinion
- Mashvisor – if you want short-term vs. long-term comparison on the same property
- Stay Today’s Short-Term Rental Cashflow Calculator – purpose-built for owners running a full P&L
Build a complete expense model. Beginners consistently underestimate the following: STR-specific insurance, lodging taxes, utilities (vacation rentals burn 20-40% more than long-term rentals), internet, supplies, professional cleaning, repairs and maintenance (budget 8-12% of gross revenue), professional photography, software stack ($60-$150/month), and property management fees (typically 15-25% if outsourced).
Take whichever revenue estimate is lower and discount it another 15% for first-year ramp. If the deal still works, you’ve found a legitimate opportunity.
Step 7: Pressure-Test Your Numbers
Before committing, stress-test against three downside scenarios:
- Regulation tightens – primary-residence requirement or night caps imposed.
- Supply surges 15% in your submarket within two years.
- A recession compresses ADR by 10% and occupancy by 5 points.
If the deal still produces positive cash flow under any two of these conditions, it’s resilient. If it requires all three to stay favorable, it’s speculative.
Best Airbnb Market Research Tools in 2026
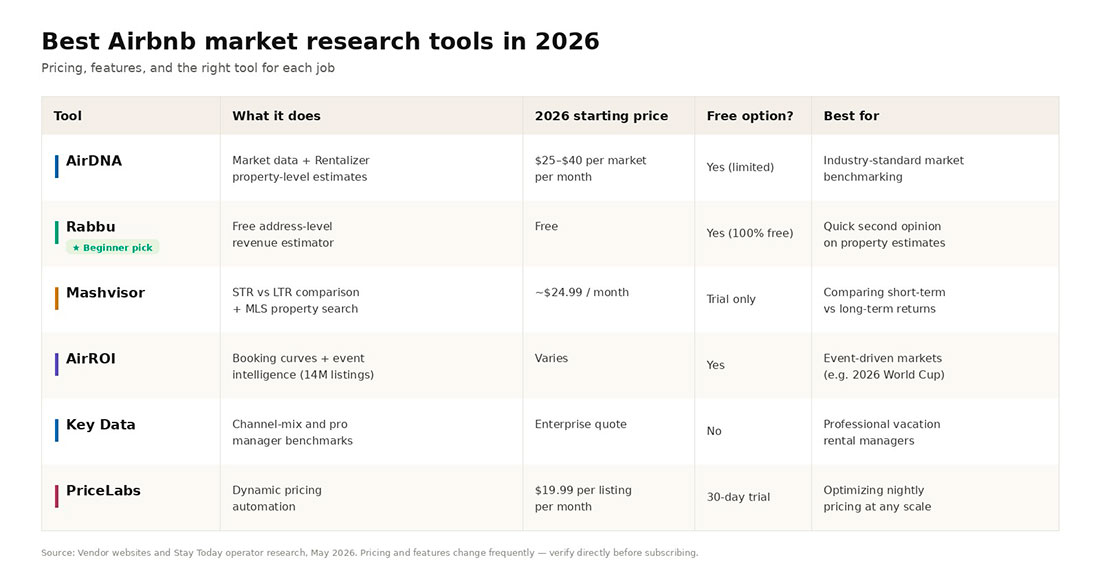
A practical, beginner-friendly stack:
- AirDNA – Market data and Rentalizer property estimates. Free tier available; Professional plans run roughly $25-$40 per market per month.
- Rabbu – Free property-level revenue estimator. Excellent quick check.
- Mashvisor – STR vs. LTR comparison and MLS-integrated property search. Starting around $25/month.
- AirROI – Search and booking-curve intelligence across 14M+ listings. Strong for event-driven markets (like 2026 World Cup host cities).
- Key Data – Quarterly Key Data Index with deep channel-mix benchmarks. Often used by professional managers.
- PriceLabs – Dynamic pricing automation at $19.99 per listing per month. The professional standard.
Most beginners don’t need everything. Starting with AirDNA’s free tier plus Rabbu’s free estimator will get you 80% of the way there.
5 Common Mistakes Beginners Make
- Trusting one revenue estimator. Rentalizer, Rabbu, and Mashvisor can differ by 20-30% in either direction. Always triangulate.
- Ignoring seasonality. Annualized averages hide that you may earn 60% of revenue in 4 months.
- Underwriting today’s regulation as permanent. The ordinance you buy under is rarely the one you’ll operate under in five years.
- Skipping the comp set walk. Tools can’t see your specific street’s parking, noise, or HOA culture. Walk the block.
- Confusing gross yield with cap rate. A 14% gross yield in a low-cost market often becomes a 4% cap rate after honest expenses.
Frequently Asked Questions
In most U.S. short-term rental markets, roughly 20% of listings generate roughly 80% of the revenue. The top-performing listings tend to share three traits: better design and amenities, smarter pricing, and stronger review velocity. Your goal isn't to be average. It's to engineer your property and operations to be in that top 20%.
AirDNA's address-level estimates are generally credible in markets with abundant comparable listings, but they can be 15–25% off in thin or unusual submarkets. Treat any single tool's projection as a starting point, not a guarantee.
You can run a credible first-pass analysis entirely on free tools - AirDNA's free tier, Rabbu's free estimator, and direct research on Airbnb and Vrbo. For a serious purchase, expect to spend $25–$100 on a paid AirDNA market or Mashvisor subscription, plus a few hours of your time.
In most U.S. markets, 5–10% is healthy. Below 4% generally only makes sense in supply-constrained metros with capital appreciation tailwinds. Above 12% usually means either an emerging market or a deal with hidden risk - verify with multiple sources.
Start with three sources: AirDNA's free MarketMinder tier for macro data, the Airbnb and Vrbo websites directly to study comp sets and seasonality, and the relevant city government's short-term rental page for current regulations. Cross-reference results before drawing conclusions.
Next Steps
A solid vacation rental market analysis isn’t complicated. It’s just thorough. The owners who consistently outperform are the ones who run all seven steps before buying, then re-run the relevant pieces every six months once they’re operating.
If you’re working through a specific market – particularly in Florida, Colorado, or Tennessee – and want a second set of eyes on your numbers, talk to a local Stay Today market expert. Our team analyzes new markets and properties every week and can quickly tell you whether the numbers you’re seeing match what professional managers are actually achieving on the ground.
Either way, do the work. The data is better than it’s ever been. There’s no reason to invest blind.